Teens
National Immunization Survey-Teen (NIS-Teen) 2022, Texas
Immunization Coverage among Texas Teens 13-17 Years Old
About the National Immunization Survey-Teen (NIS-Teen)
The NIS-Teen is a national survey conducted every year by the Centers for Disease Control and Prevention (CDC) to assess vaccination coverage levels, or the percentage of people vaccinated, among adolescents 13-17 years of age. This study collects data using a random-digit–dialed method to survey parents and guardians of eligible teen on their sociodemographic characteristics, followed by a mailed questionnaire to the teen’s vaccination providers to obtain their vaccination history. The parents and guardians of eligible teens are asked during the telephone interview for consent to contact the adolescents’ vaccination providers to verify their records.
The NIS-Teen was established to provide an ongoing and consistent data set for analyzing vaccination coverage levels among adolescents in the United States and to share this information with interested public health partners. The NIS-Teen provides national and statewide estimates of vaccination coverage, including new vaccines as they are licensed and recommended for use. It also helps track progress towards the Healthy People 2030 goals.
Survey Sample
The survey assessed the vaccination histories of 794 Texas teens, including 157 teens in the City of Houston 253 teens in Bexar County, aged 13-17 years between January 2022 and February 2023. These teens were born between January 2004 and January 2010. A total of 794 Texas teens were interviewed as part of this study, with estimated vaccination coverage levels for the state of Texas and two local Texas areas – the City of Houston and Bexar County.
Vaccines Included
The following vaccine doses routinely recommended for adolescents starting at 11-12 years of age, were measured in the 2022 NIS-Teen:
- ≥1 dose of Tetanus-diphtheria-pertussis (Tdap) vaccine
- ≥1 dose of Quadrivalent Meningococcal Conjugate (MenACWY) vaccine
- ≥1 dose of human papillomavirus (HPV) vaccine
- HPV vaccine up-to-date (UTD), either two or three doses dependent on age of initiation
The NIS-Teen also measures coverage for the following catch-up schedule vaccines, for teens who did not complete them as recommended when they were younger:
- ≥2 doses measles, mumps, and rubella (MMR) vaccine.
- ≥2 doses varicella (Var) vaccine.
- ≥2 doses hepatitis A (HepA) vaccine.
Vaccination Coverage Levels
NIS-Teen Immunization Coverage Estimates in the U.S and Texas, 2022
|
Vaccine |
U.S. 2022 |
Texas 2021 |
Texas 2022 |
Texas |
|---|---|---|---|---|
|
≥1 dose of tetanus-diphtheria- |
89.9% |
87.1% |
85.0% |
-2.1% |
|
≥1 dose of meningococcal |
88.6% |
90.0% |
86.5% |
-3.5% |
|
≥1 dose of human |
76.0% |
71.3% |
70.3% |
-1.0% |
|
HPV Up-To-Date (HPV UTDb) |
62.6% |
51.5% |
58.5% |
7.0% |
|
≥1 dose of HPV, females |
77.8% |
73.4% |
77.8% |
4.4% |
|
HPV UTDb, females |
64.6% |
54.8% |
63.5% |
8.7% |
|
≥1 dose of HPV, males |
74.4% |
69.2% |
63.0%a |
-6.2% |
|
HPV UTDb, males |
60.6% |
48.3% |
53.7% |
5.4% |
|
≥2 doses of measles, mumps, |
91.2% |
84.1% |
80.9% |
-3.2% |
|
≥2 doses of varicella (Var) |
90.8% |
84.7% |
80.4%a |
-4.3% |
|
≥2 doses of hepatitis A (HepA) |
85.0% |
84.3% |
80.6% |
-3.7% |
a Significantly lower (p<0.05) than the U.S. estimate
b HPV UTD reflects full vaccination coverage regardless of whether a teen followed a 2-dose (started series before age 15) or 3-dose HPV vaccine series (started series after age 15).
See accessible data table of chart below:
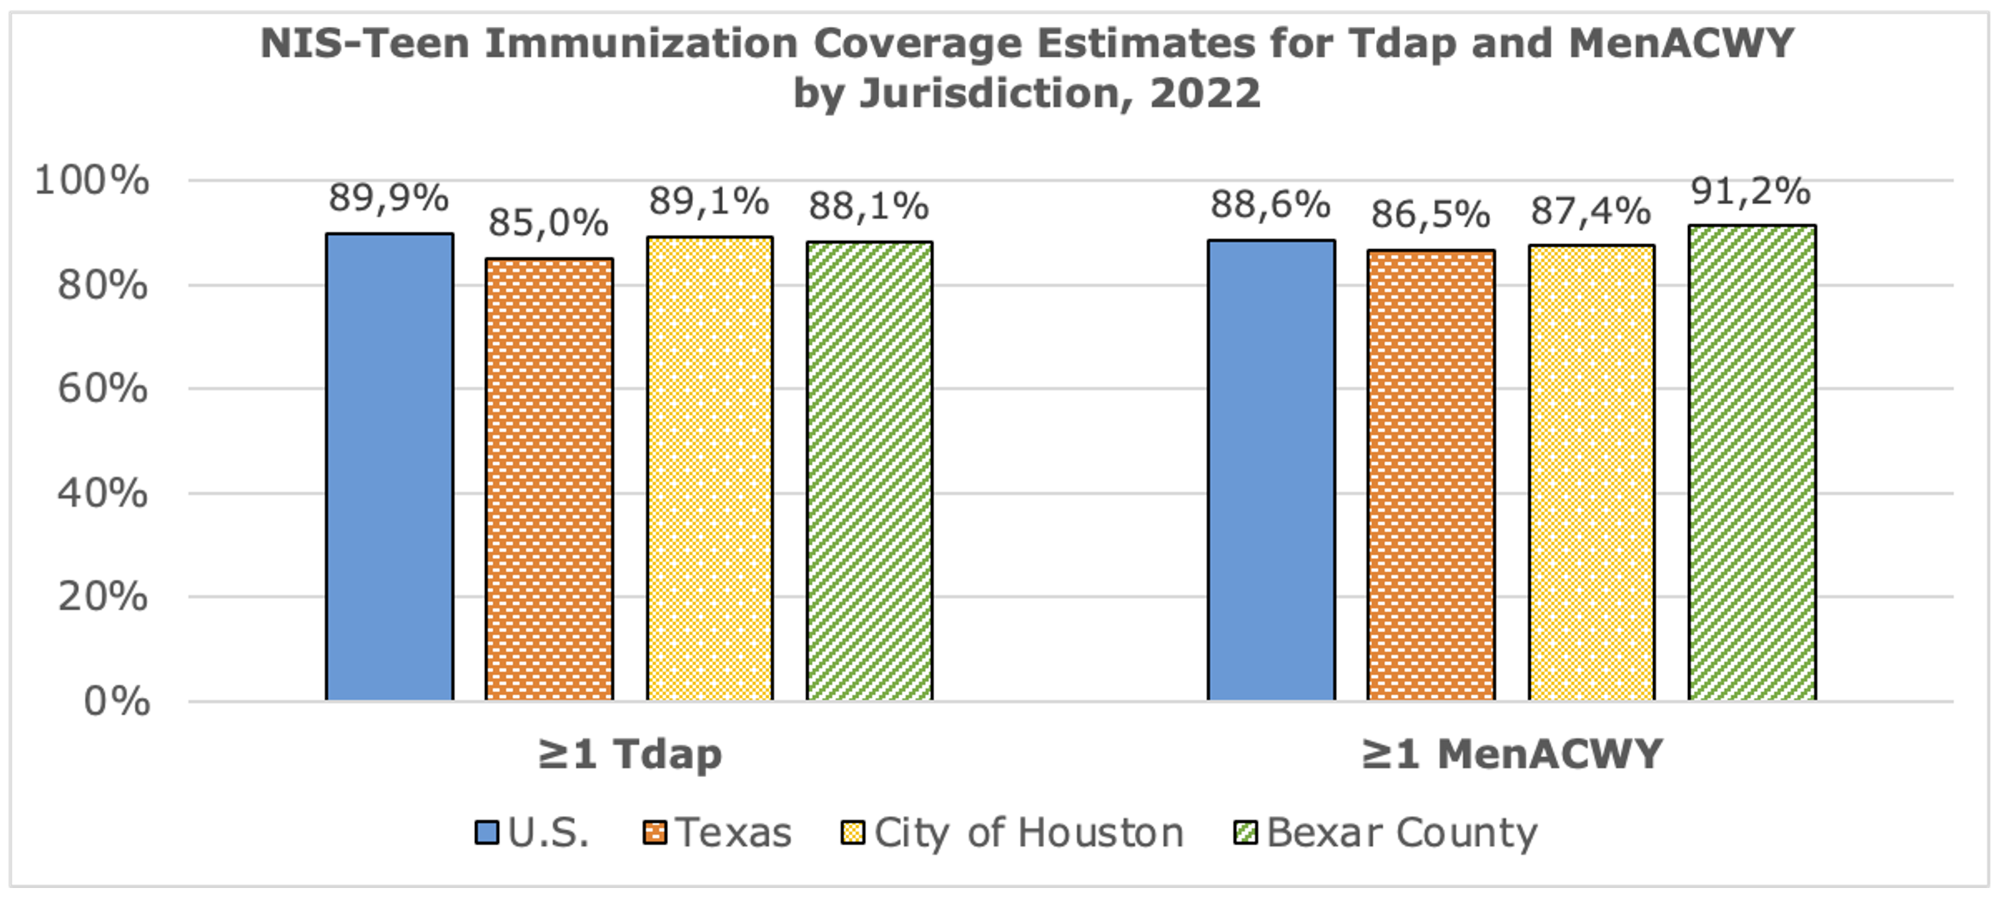
NIS-Teen Immunization Coverage Estimates for Tdap and MenACWY by Jurisdiction, 2022
|
Vaccine |
U.S. |
Texas |
City of |
Bexar |
|
|---|---|---|---|---|---|
|
≥1 Tdap |
89.9% |
85.0% |
89.1% |
88.1% |
|
|
≥1 MenACWY |
88.6% |
86.5% |
87.4% |
91.2% |
|
See accessible data table of chart below:
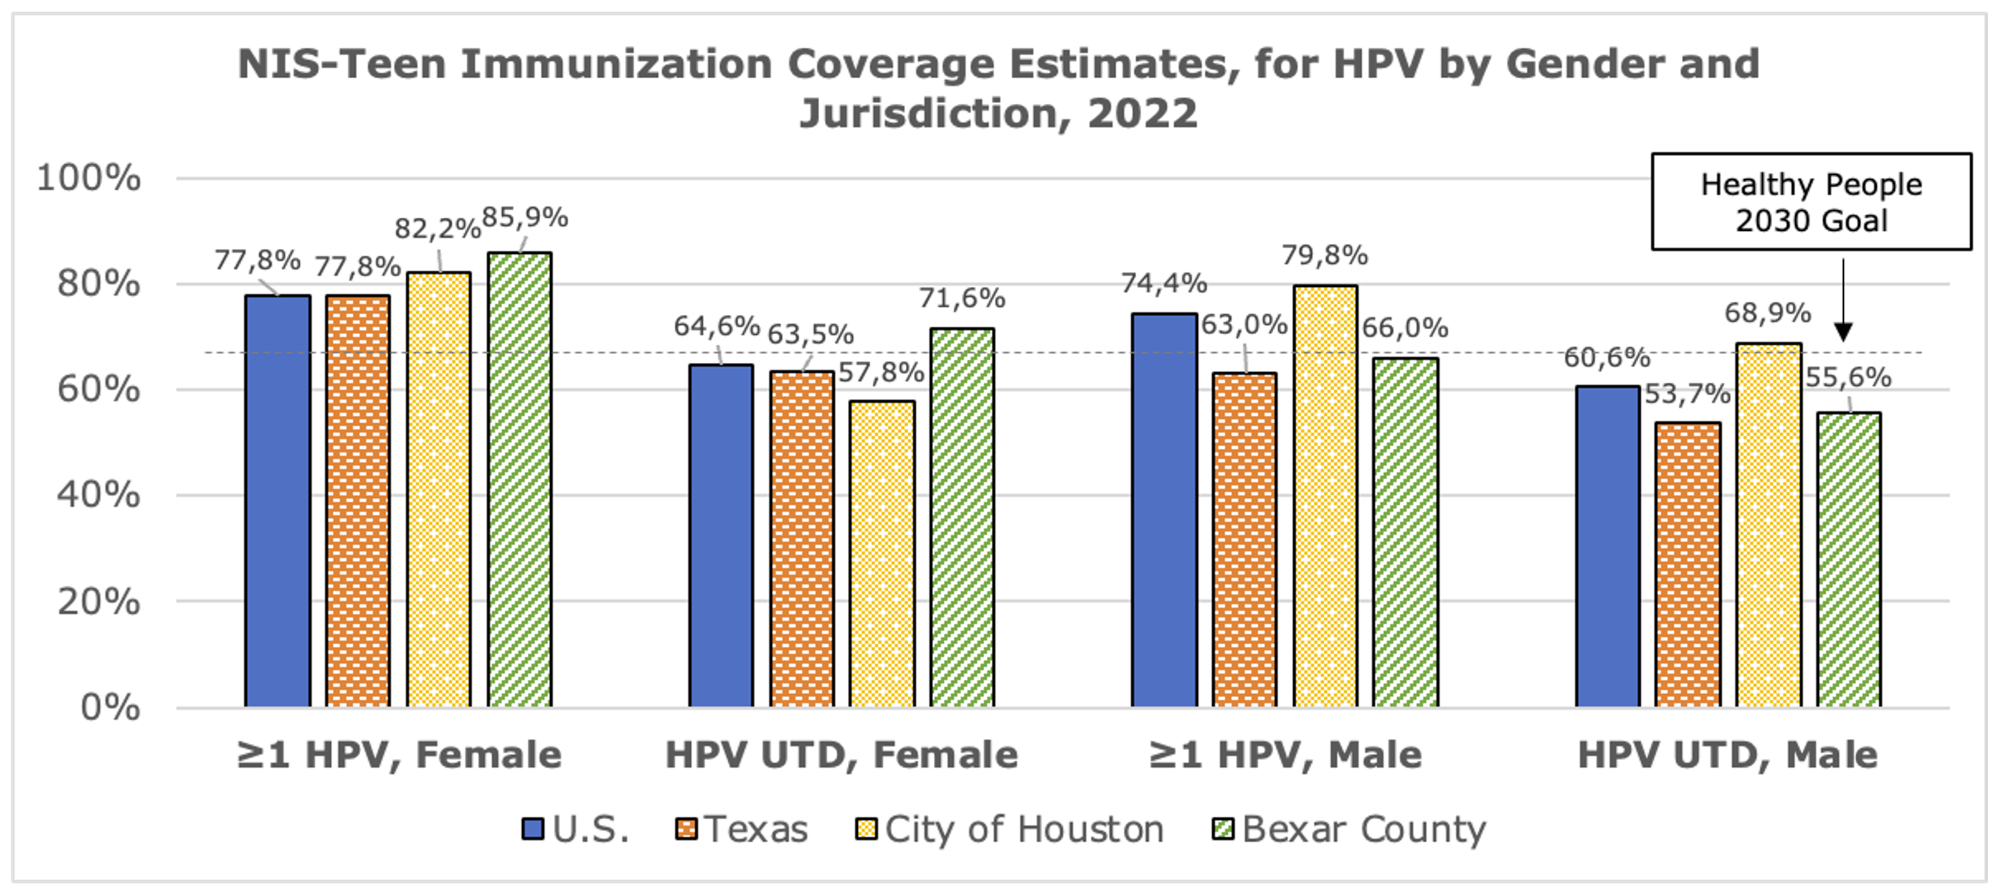
NIS-Teen Immunization Coverage Estimates for HPV by Gender and Jurisdiction, 2022
|
Vaccine |
U.S. |
Texas |
City of |
Bexar |
||||
|---|---|---|---|---|---|---|---|---|
|
≥1 HPV, Female |
77.8% |
77.8% |
82.2% |
85.9% |
||||
|
HPV UTD, Female |
64.6% |
63.5% |
57.8% |
71.6% |
||||
|
≥1 HPV, Male |
74.4% |
63.0% |
79.8% |
66.0% |
||||
|
HPV UTD, Male |
60.6% |
53.7% |
68.9% |
55.6% |
||||
See accessible data table of chart below:
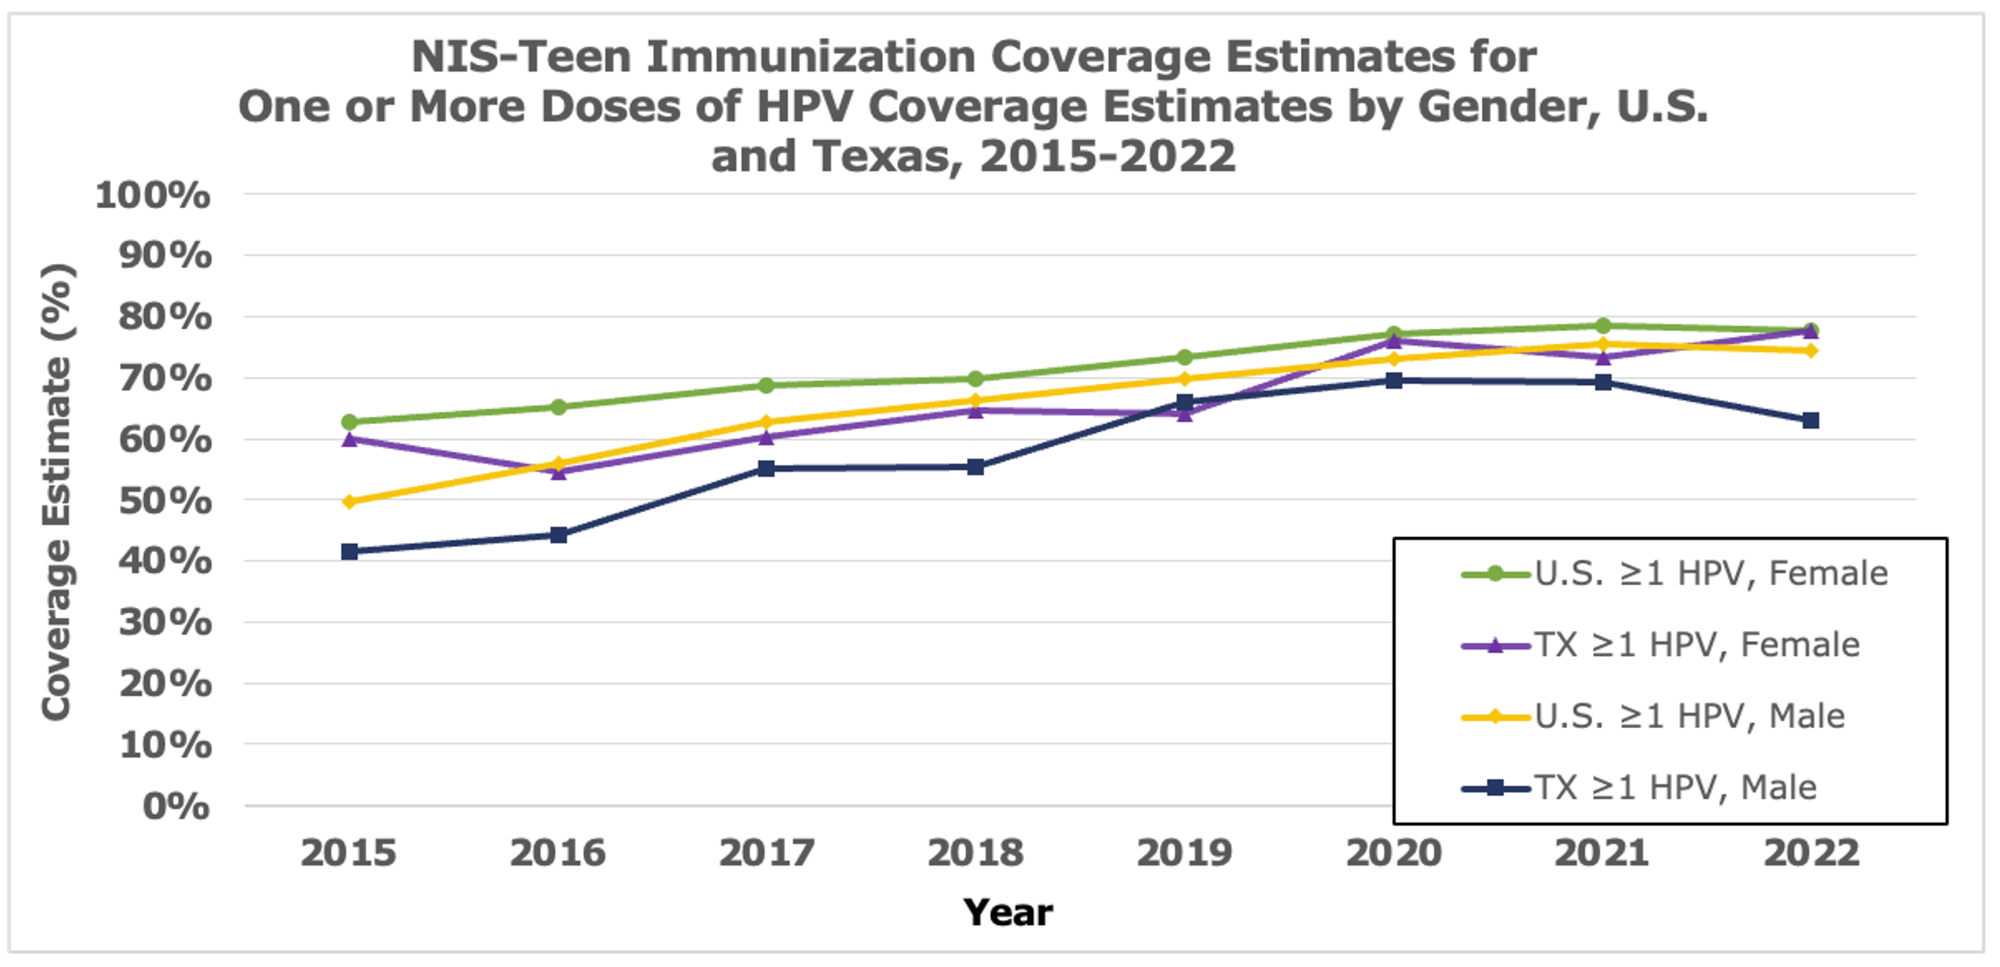
Immunization Coverage Estimates for One or More Doses of HPV Coverage Estimates, by Gender, U.S. and Texas, 2015-2022
|
|
2015 |
2016 |
2017 |
2018 |
2019 |
2020 |
2021 |
2022 |
|---|---|---|---|---|---|---|---|---|
|
U.S. Female |
62.8% |
65.1% |
68.6% |
69.9% |
73.2% |
77.1% |
78.5% |
77.8% |
|
Texas, Female |
60.1% |
54.5% |
60.4% |
64.6% |
64.2% |
76.1% |
73.4% |
77.8% |
|
U.S. Male |
49.8% |
56.0% |
62.6% |
66.3% |
69.8% |
73.1% |
75.4% |
74.4% |
|
Texas, Male |
41.4% |
44.3% |
55.2% |
55.5% |
65.9% |
69.6% |
69.2% |
63.0% |