Border Report Section 6 – Tuberculosis
The rate of tuberculosis (TB) on the Texas-Mexico border has typically been higher than the rest of the state. Being born in a foreign country is a risk factor for TB and a large proportion of the population living on the Texas-Mexico border was born in Mexico or Central America. Higher than average rates of TB are also found in Houston and Dallas, where a large proportion of the population is also foreign-born.
Table 8a: Tuberculosis Diagnoses and Rate by EMA/TGA, 2017
| Area |
TB Diagnoses Number |
TB Diagnoses Rate* |
|---|---|---|
|
Texas |
1,127 |
4.0 |
|
Austin TGA |
49 |
2.3 |
|
Dallas EMA |
213 |
4.3 |
|
Fort Worth TGA |
88 |
3.6 |
|
Houston EMA |
328 |
5.3 |
|
San Antonio TGA |
78 |
3.4 |
|
East Texas TGA |
51 |
1.9 |
|
All Other Texas |
101 |
2.1 |
|
Texas-Mexico Border |
219 |
7.9 |
* Rate per 100,000 population
Source: Texas TB Program Area Module as of 2017
Table 8b: Counties Where Tuberculosis Diagnosis Rate Exceeds the Texas-Mexico Border Region Average, 2017
| County |
TB Diagnoses Number |
TB Diagnoses Rate* |
|---|---|---|
|
Brooks |
2 |
27.6 |
|
Cameron |
52 |
12.3 |
|
Frio |
12 |
61.2 |
|
Kinney |
1 |
26.7 |
|
La Salle |
1 |
13.2 |
|
Maverick |
7 |
12.0 |
|
Reeves |
3 |
19.6 |
|
Starr |
9 |
14.0 |
|
Val Verde |
11 |
22.4 |
|
Webb |
25 |
9.1 |
|
Willacy |
2 |
9.3 |
* Rate per 100,000 population
Source: Texas TB Program Area Module as of 2017
Rates of TB have been declining for both the state and the Texas-Mexico border region and are currently at their lowest levels since 1993 (Figure 6). However, rates in the border region remain twice as high as the state rate overall.
Figure 6. Tuberculosis Rates for the Texas-Mexico Border Region and Texas, 2008-2017
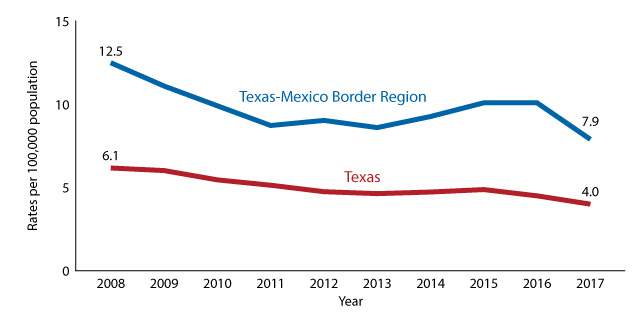
Source: Texas TB PAM as of 2017
Data for Figure 6
The demographics of persons diagnosed with TB on the Texas-Mexico border are similar to the state overall. Persons with TB in the Texas-Mexico border region tend to be less than 45 years old and are overwhelmingly Hispanic (93%), reflecting the demographics of the local general population. Diabetes, foreign birth, and incarceration are more common risk factors for persons with TB on the Texas-Mexico border, whereas homelessness is less common.
Table 9: Demographics of TB Cases Diagnosed in the Texas-Mexico Border Region and Texas, 2017
|
Texas-Mexico Border Region |
Texas |
|||||
|---|---|---|---|---|---|---|
| Demographics |
Count |
Percent1 |
Rate* |
Count |
Percent1 |
Rate* |
| Total |
219 |
100% |
7.9 |
1,127 |
100% |
4.0 |
| Sex |
|
|
|
|
|
|
|
Male |
147 |
67% |
10.7 |
734 |
65% |
5.2 |
|
Female |
72 |
33% |
5.1 |
393 |
35% |
2.8 |
| Race |
|
|
|
|
|
|
|
White |
2 |
1% |
0.8† |
96 |
9% |
0.8 |
|
Black |
11 |
5% |
30.9 |
213 |
19% |
6.3 |
|
Hispanic |
203 |
93% |
8.3 |
593 |
53% |
5.3 |
|
Other |
3 |
1% |
7.1 |
225 |
20% |
11.9 |
| Age Group |
|
|
|
|
|
|
|
0-14 |
15 |
7% |
2.1 |
57 |
5% |
0.9 |
|
15-24 |
32 |
15% |
7.1 |
109 |
10% |
2.7 |
|
25-34 |
33 |
15% |
8.7 |
173 |
15% |
4.2 |
|
35-44 |
33 |
15% |
9.5 |
197 |
17% |
5.2 |
|
45-54 |
19 |
9% |
6.1 |
179 |
16% |
5.0 |
|
55-64 |
31 |
14% |
11.9 |
186 |
17% |
5.8 |
|
65+ |
56 |
26% |
17.0 |
226 |
20% |
6.5 |
| Risk Factors^ |
|
|
|
|
|
|
|
Foreign Born |
146 |
67% |
- |
689 |
61% |
- |
|
Alcohol Abuse |
26 |
12% |
- |
130 |
12% |
- |
|
Diabetes |
53 |
24% |
- |
213 |
19% |
- |
|
Correctional Facility |
41 |
19% |
- |
94 |
8% |
- |
|
Homelessness |
2 |
1% |
- |
40 |
4% |
- |
|
HIV Infection |
11 |
5% |
- |
73 |
6% |
- |
* Rate per 100,000 people
† Rates calculated with a numerator of ≤5 are statistically unstable and should be interpreted with caution
^ Risk factors are not mutually exclusive, TB cases can have multiple risk factors.
Source: Texas TB PAM as of 2017
Certain tuberculosis outcomes for persons living in the Texas-Mexico border region were slightly worse than the state overall. While slightly fewer persons (5%) died prior to therapy completion in the border region compared to the state overall (6%)more of persons living in the border region died within a month of diagnosis (3%) compared to cases statewide (2%). Three percent of cases were lost to follow up in the border region compared to two percent statewide. About two percent of cases were diagnosed after death, indicating a missed opportunity for screening, detection, and treatment. Diagnoses after death may also indicate a missed opportunity to prevent transmission of TB infection to others.
Table 10: TB Outcomes for Cases Diagnosed in 2015
|
Texas-Mexico |
Texas |
|||
|---|---|---|---|---|
| Case Outcome |
Number |
Percent |
Number |
Percent |
|
Cases lost to follow-up |
7 |
3% |
24 |
2% |
|
Cases that died prior to therapy completion |
14 |
5% |
76 |
6% |
|
Deaths that occurred ≤30 days of diagnosis |
7 |
3% |
33 |
2% |
|
Cases Diagnosed after Death |
6 |
2% |
23 |
2% |
Source: Texas TB PAM as of 2017
HIV, STDs, and TB in the Texas-Mexico Border Region