Legionellosis (Legionnaires’ Disease) Data
Home Legionellosis (Legionnaires’ Disease) Task Force Recommendations | Texas DSHS
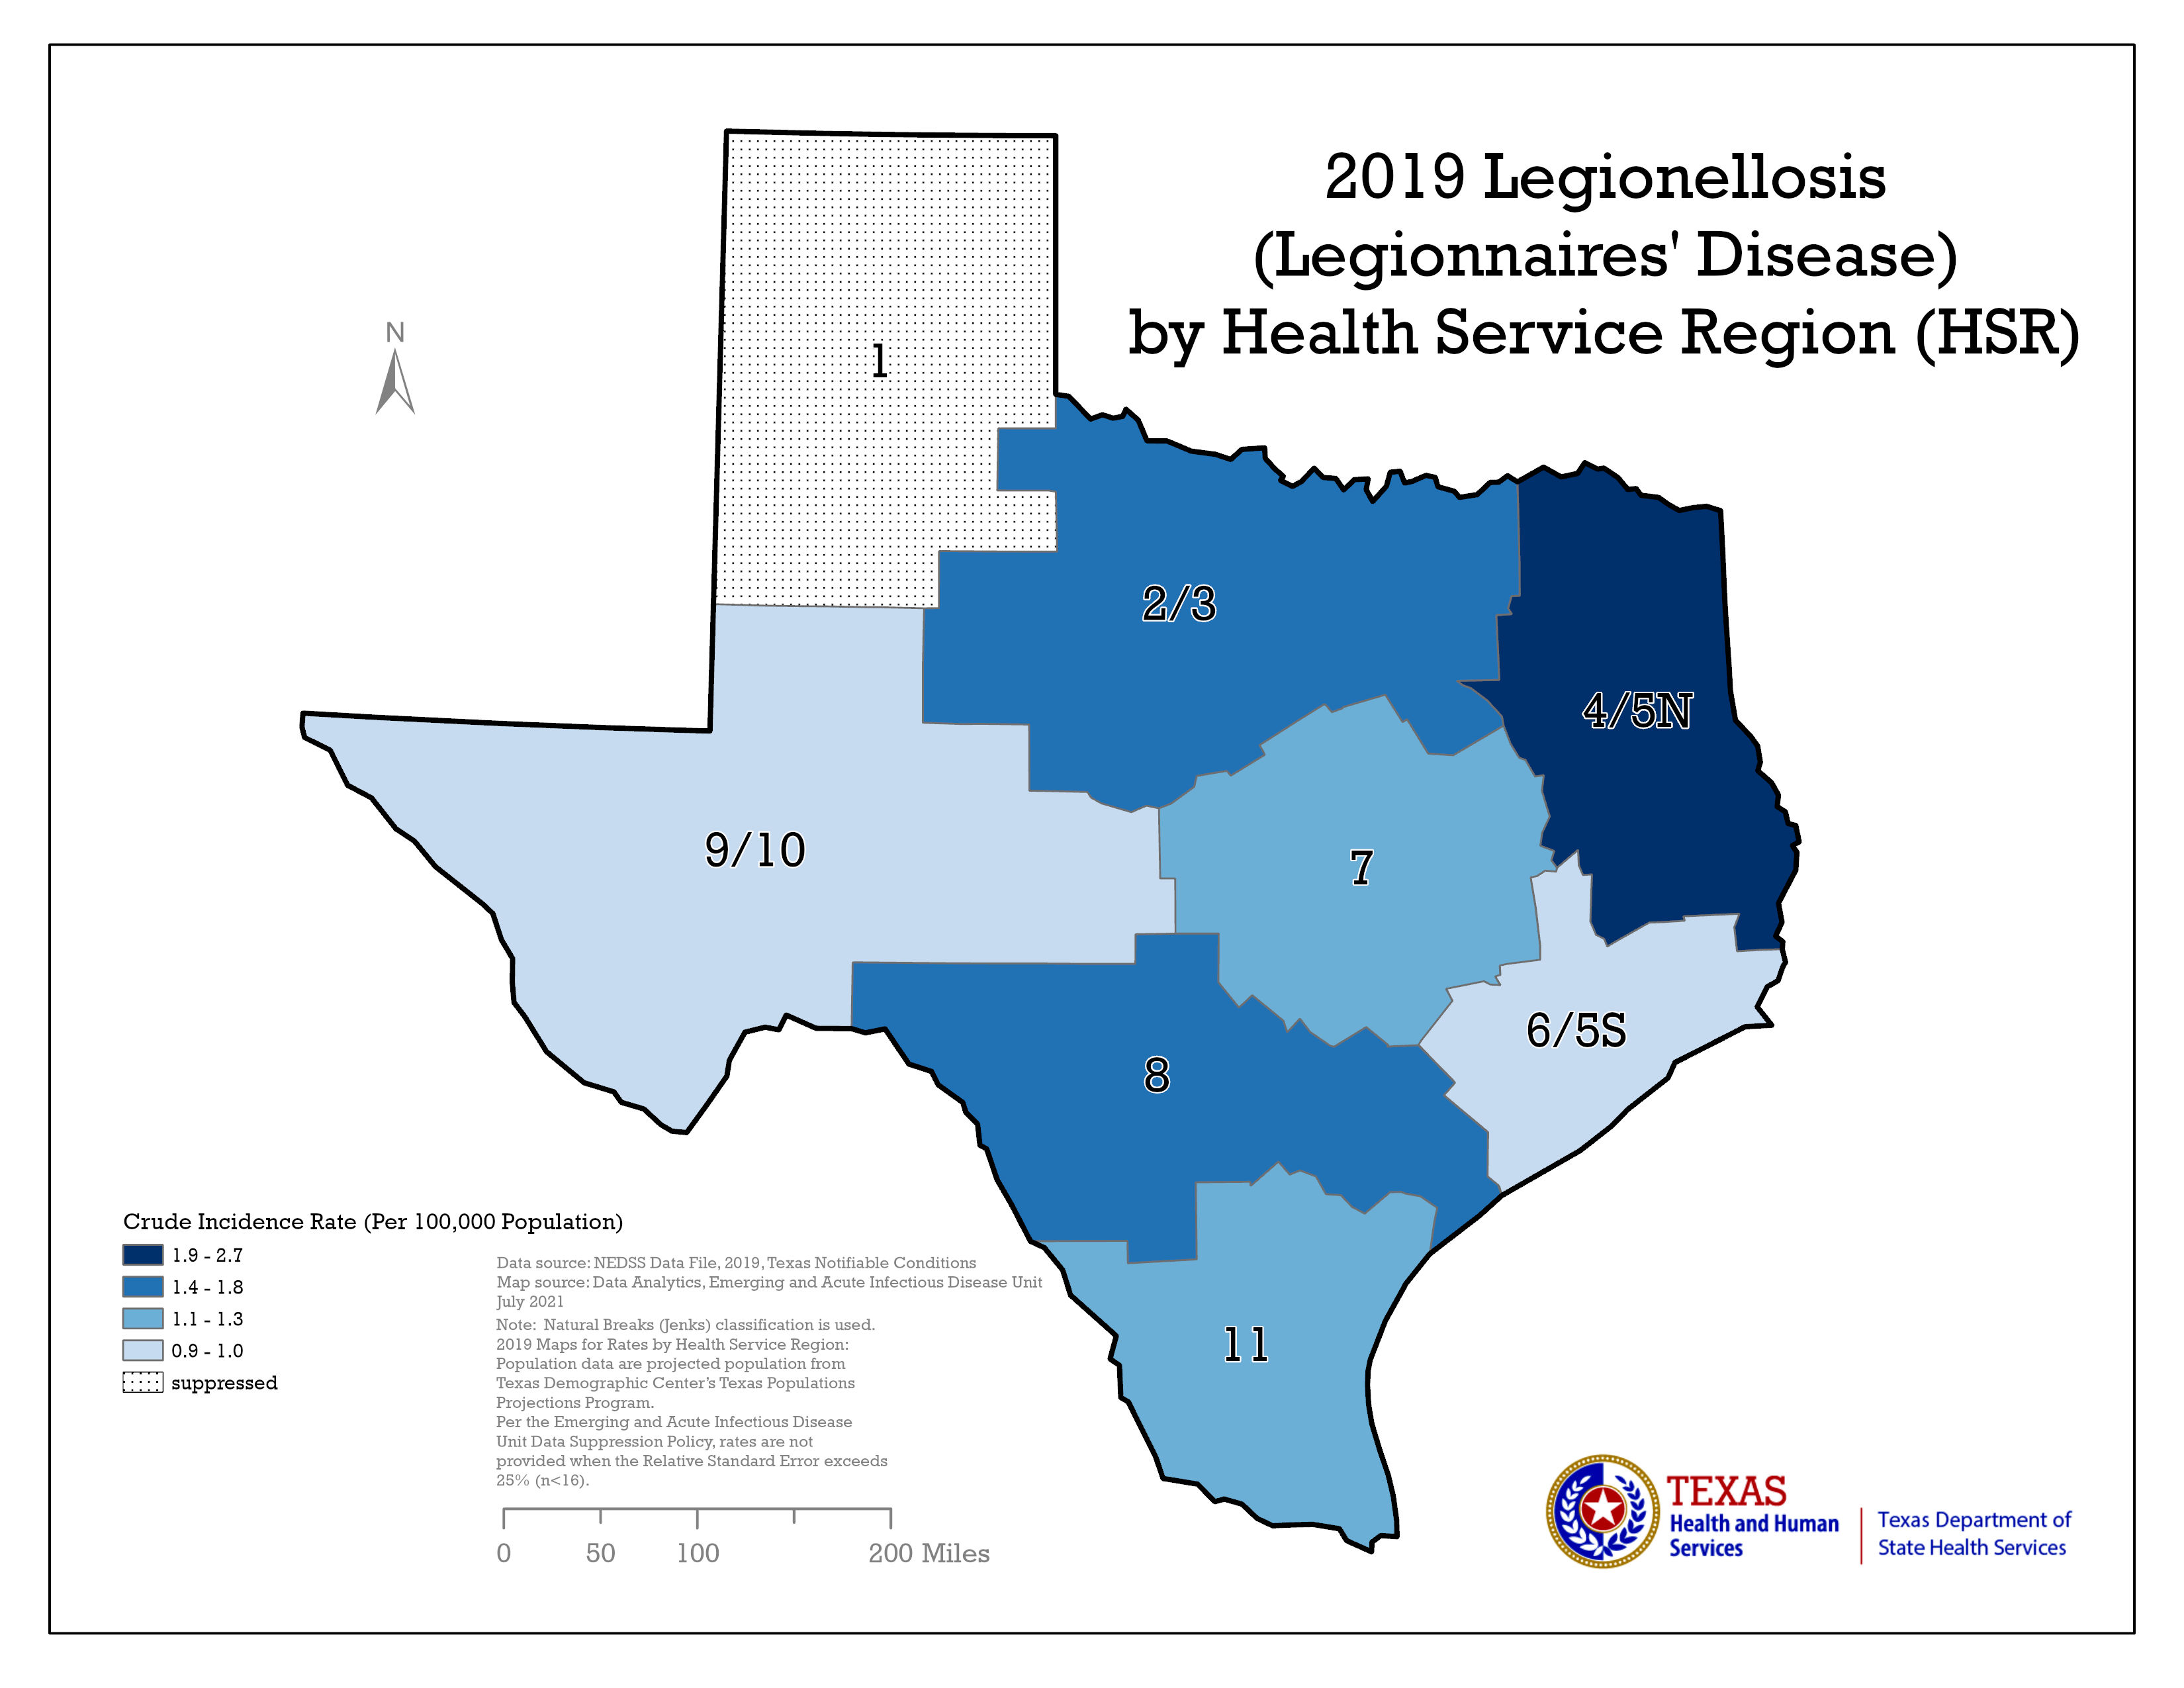
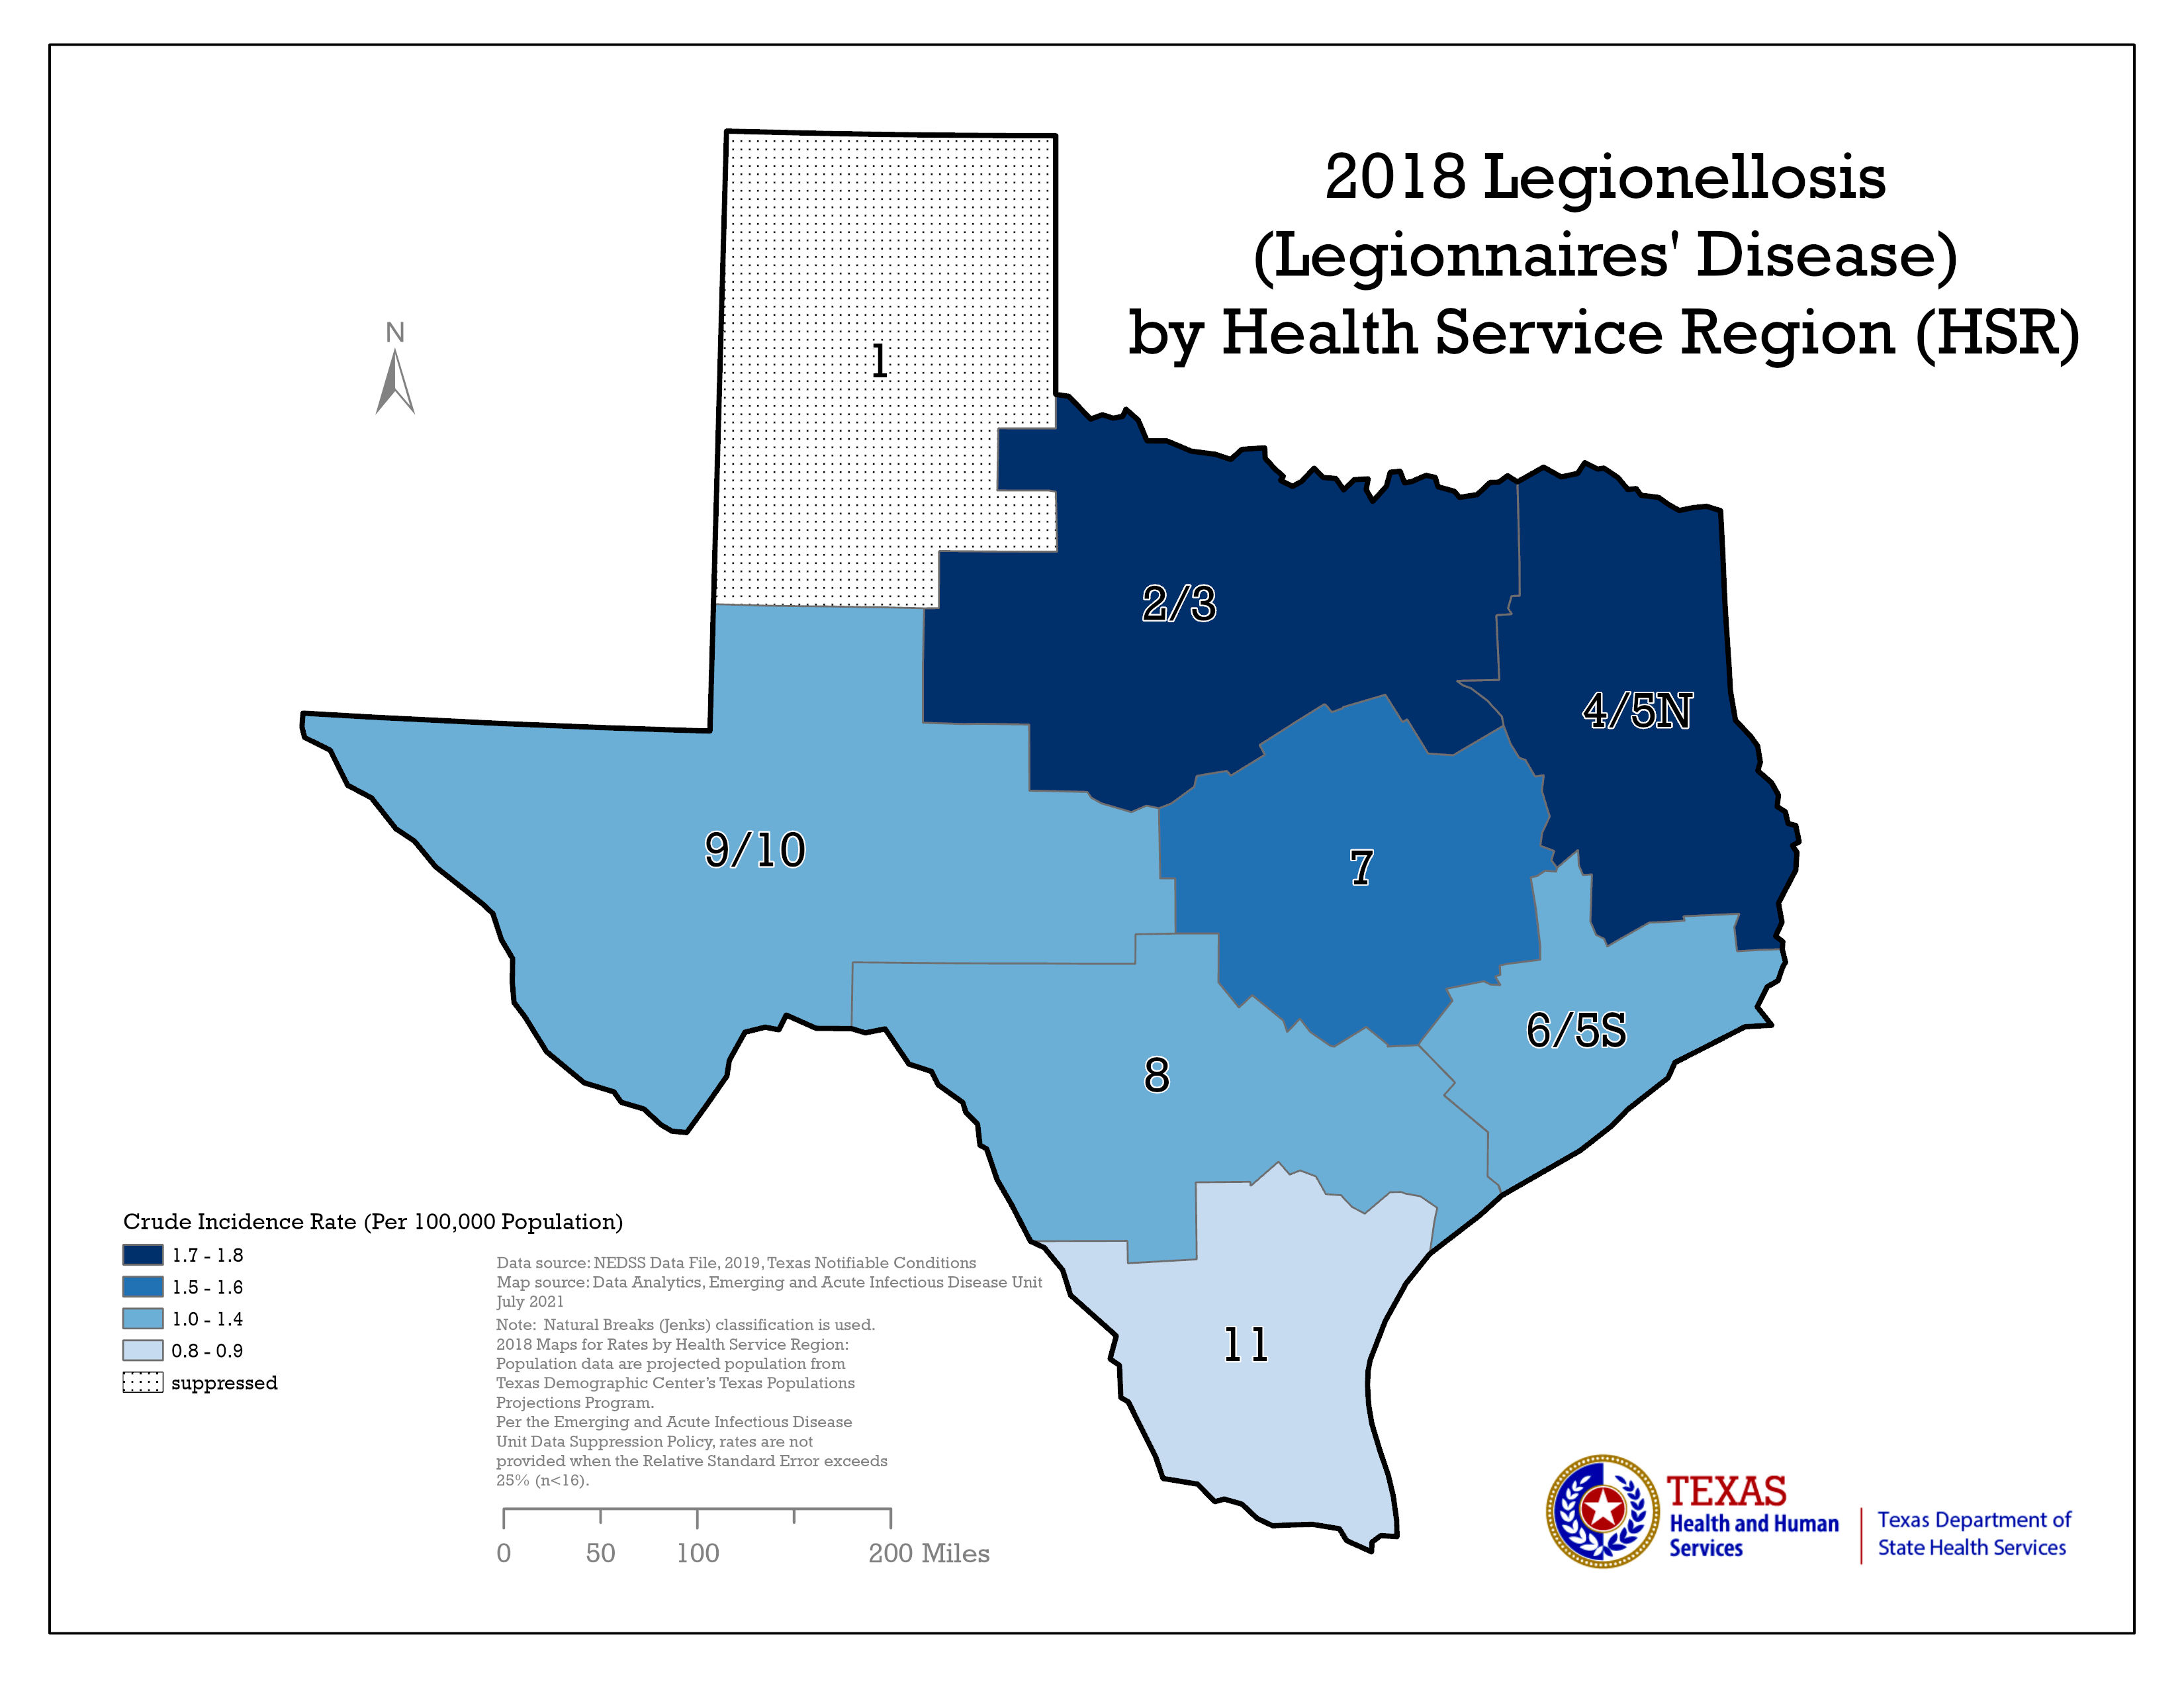
Legionellosis Incidence Rate Map, Texas County by Year (jpg image)
| Legionellosis Cases and Incidence Rates for Texas, 2010-2023 | ||
| Year | Case Count | Incidence Rate |
| 2023 | 436 | 1.4 |
| 2022 | 348 | 1.1 |
| 2021 | 358 | 1.2 |
| 2020 | 316 | 1.1 |
| 2019 | 421 | 1.4 |
| 2018 | 415 | 1.4 |
| 2017 | 327 | 1.1 |
| 2016 | 270 | 1.0 |
| 2015 | 292 | 1.1 |
| 2014 | 256 | 0.9 |
| 2013 | 168 | 0.6 |
| 2012 | 158 | 0.6 |
| 2011 | 111 | 0.4 |
| 2010 | 136 | 0.5 |
| aIncidence rates (IR) are calculated per 100,000 population. Population data are projected population from Texas Demographic Center’s Texas Populations Projections Program; 2020 and 2019 population projections were updated March 2022, and 2018 & earlier population projections were from the prior version. Data Source: Texas NEDSS Finalized Data File, 2015-2023, Texas Notifiable Conditions. | ||
| Legionellosis Cases and Incidence Ratesa by Age Group, 2018-20232 | ||||||||||
| 2018 | 2019 | 2020 | 2021 | 2022 | ||||||
| Age Group | Count | IR | Count | IR | Count | IR | Count | IR | Count | IR |
| <1 | 0 | 0.0 | - | - | 0 | 0.0 | 0 | - | - | - |
| 01-04 | 0 | 0.0 | 0 | 0.0 | 0 | 0.0 | 0 | - | - | - |
| 05-09 | 0 | 0.0 | 0 | 0.0 | 0 | 0.0 | 0 | - | - | - |
| 10-14 | 0 | 0.0 | - | - | 0 | 0.0 | 0 | - | - | - |
| 15-19 | 0 | 0.0 | - | - | 0 | 0.0 | 0 | - | - | - |
| 20-29 | 16 | 0.4 | 12 | - | 5 | 0.1 | 5 | - | 5 | - |
| 30-39 | 31 | 0.8 | 30 | 0.7 | 21 | 0.5 | 18 | 0.4 | 23 | 0.5 |
| 40-49 | 43 | 1.1 | 38 | 1.0 | 46 | 1.2 | 42 | 1.1 | 31 | 0.8 |
| 50-59 | 96 | 2.7 | 98 | 2.8 | 65 | 1.9 | 73 | 2.1 | 79 | 2.2 |
| 60+ | 229 | 4.4 | 238 | 4.5 | 180 | 3.3 | 220 | 3.8 | 209 | 3.5 |
| Unknown | - | - | - | - | - | - | 0 | - | 0 | - |
| Total | 415 | 1.4 | 421 | 1.4 | 317 | 1.1 | 358 | 1.2 | 348 | 1.0 |
| aIR=age group-specific incidence rate per 100,000. | ||||||||||
| Note: Per Emerging and Acute Infectious Disease Unit Data Suppression policy, beginning with data published after September 2021, subgroup case counts of 1-4 are not provided (-). Rates are not provided (-) when the Relative Standard Error exceeds 25% (n <16). Population data are projected population from Texas Demographic Center’s Texas Populations Projections Program; 2019 population projections were updated July 18, 2019, and 2018 & earlier population projections were from the prior version. Data Source: Texas NEDSS Finalized Data File, 2015-2023, Texas Notifiable Conditions. | ||||||||||
| Legionellosis Cases and Incidence Ratesa for the Most Populous Texas Counties, 2021-2022 | ||||
| County | 2021 | 2022 | ||
| Cases | IR | Cases | IR | |
| BEXAR | 33 | 1.5 | 25 | 1.1 |
| BRAZORIA | 6 | - | 2 | - |
| CAMERON | 0 | - | 1 | - |
| COLLIN | 16 | 1.5 | 14 | - |
| DALLAS | 47 | 1.7 | 52 | 1.9 |
| DENTON | 8 | - | 18 | 1.9 |
| EL PASO | 6 | - | 6 | - |
| FORT BEND | 10 | - | 6 | - |
| HARRIS | 33 | 0.7 | 27 | 0.5 |
| HIDALGO | 10 | - | 5 | - |
| MONTGOMERY | 7 | - | 7 | - |
| NUECES | 1 | - | 0 | - |
| TARRANT | 39 | 1.8 | 45 | 2 |
| TRAVIS | 36 | 2.7 | 16 | 1.2 |
| WILLIAMSON | 8 | - | 11 | - |
| STATEWIDE TOTALS | 358 | 1.2 | 348 | 1.1 |
| aIncidence rates (IR) are calculated per 100,000 population. Population data are projected population from Texas Demographic Center’s Texas Populations Projections Program, updated July 18, 2019. | ||||
| Note: Per Emerging and Acute Infectious Disease Unit Data Suppression policy, beginning with data published after September 2021, rates are not provided (-) when the Relative Standard Error exceeds 25% (n<16). Data Source: Texas NEDSS Finalized Data File, 2015-2023, Texas Notifiable Conditions. | ||||
For more data regarding this condition, please see our Infectious Disease Annual Reports or submit a Data Request.